![]()
Tableau is a powerful data visualization tool that allows users to easily analyze and present complex data in a visually appealing and interactive format. It enables users to connect to various data sources, create interactive dashboards, and explore data using a wide range of visualizations such as charts, graphs, and maps. To incorporate one of our databases into your Tableau project, simply follow these steps:
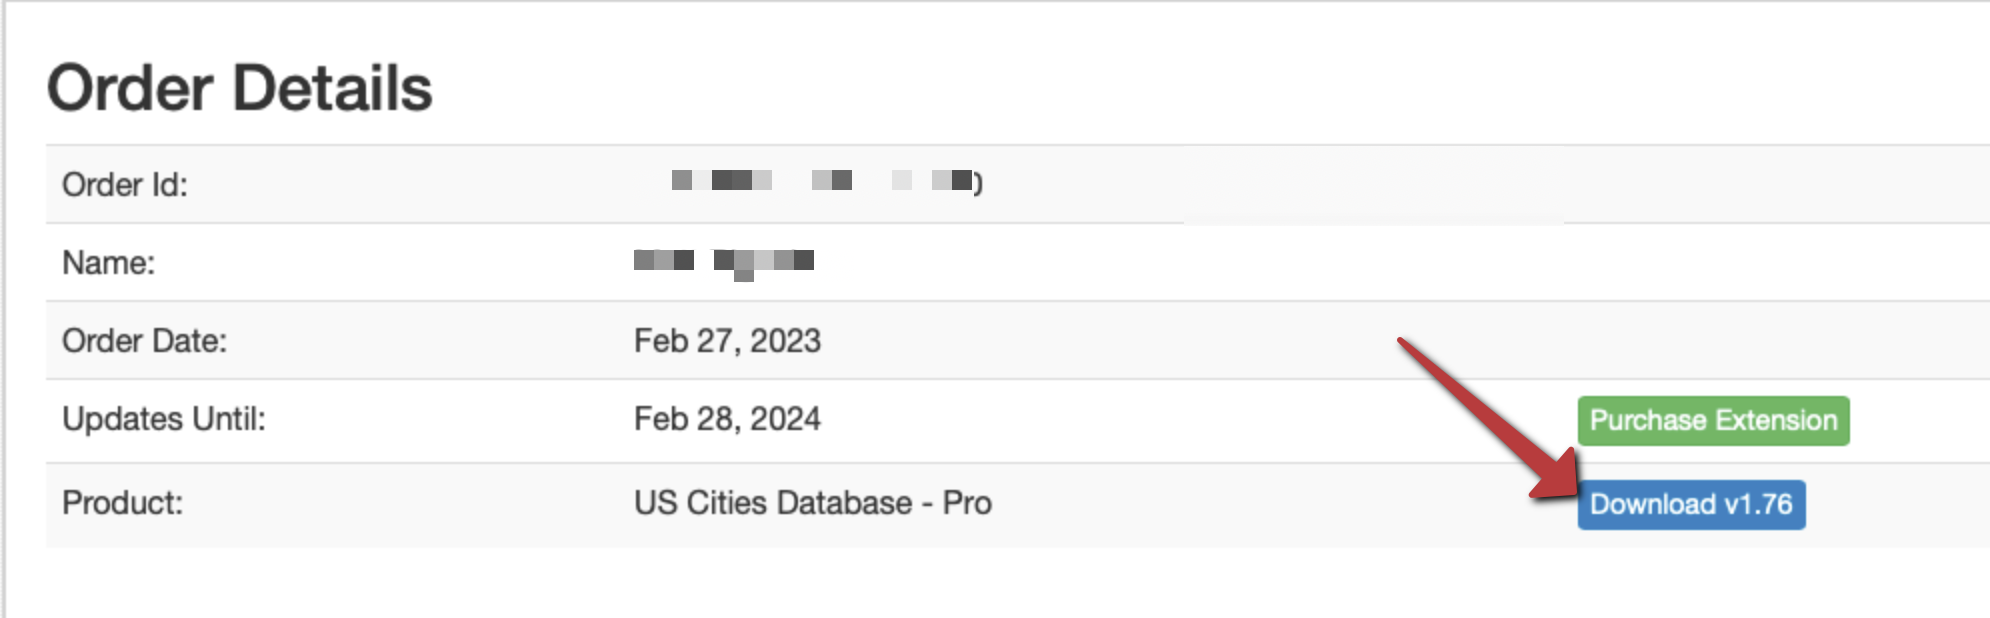
After you have completed your order, you will receive a unique URL to download your new database. Open the URL in your web browser to download the database file onto your computer.
You can also follow along in this tutorial with a free database such as our free Basic US Cities Database
 .
.
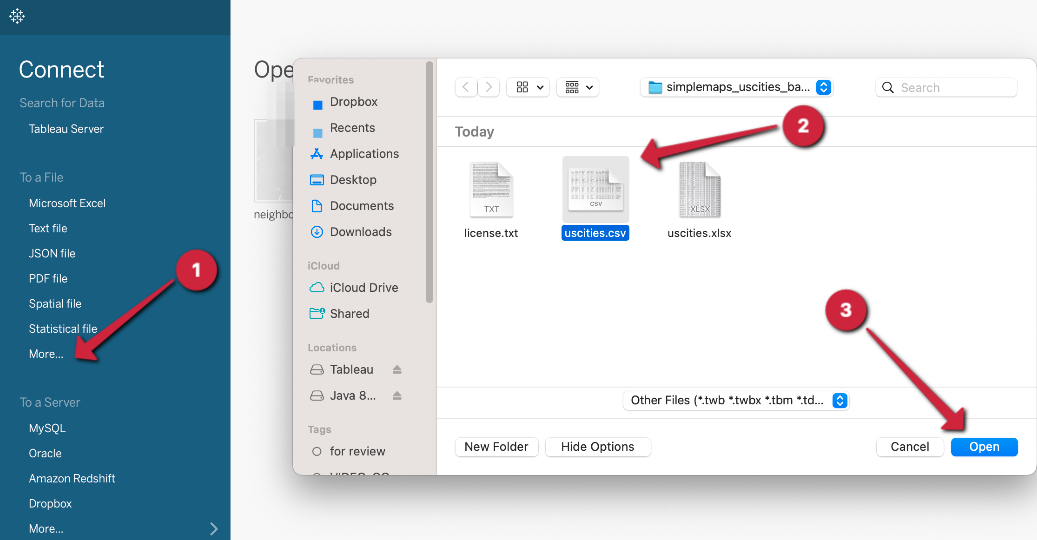
Open Tableau and select "Connect to Data" from the start page. In the "To a File" section, click "More..." and select the CSV file that you downloaded in step 1. Click "Open" to load the file into Tableau.
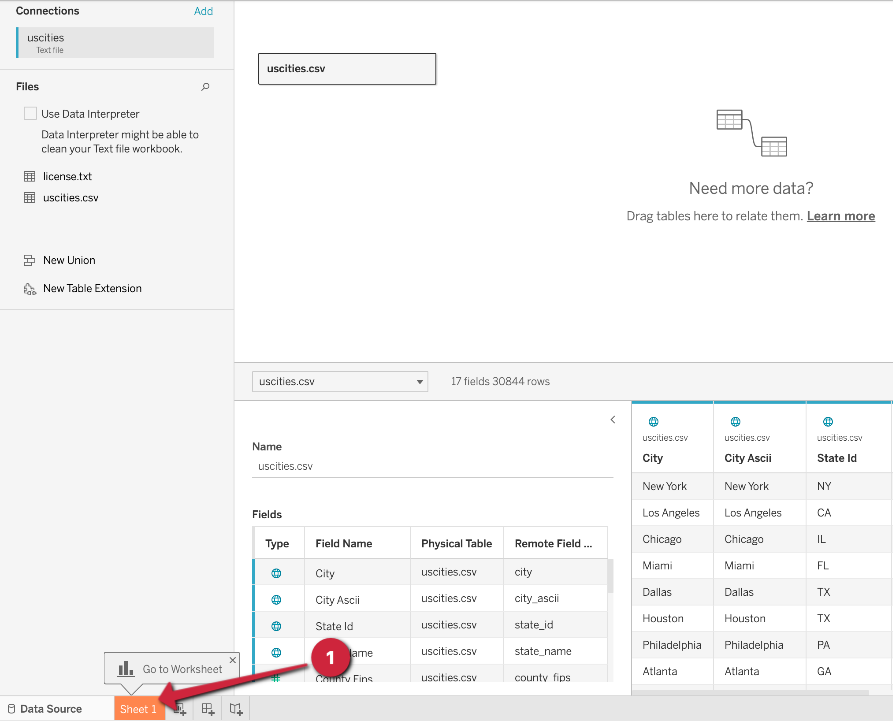
Once the file has been loaded, click "Sheet 1" at the bottom of the screen to start working on your Tableau project!
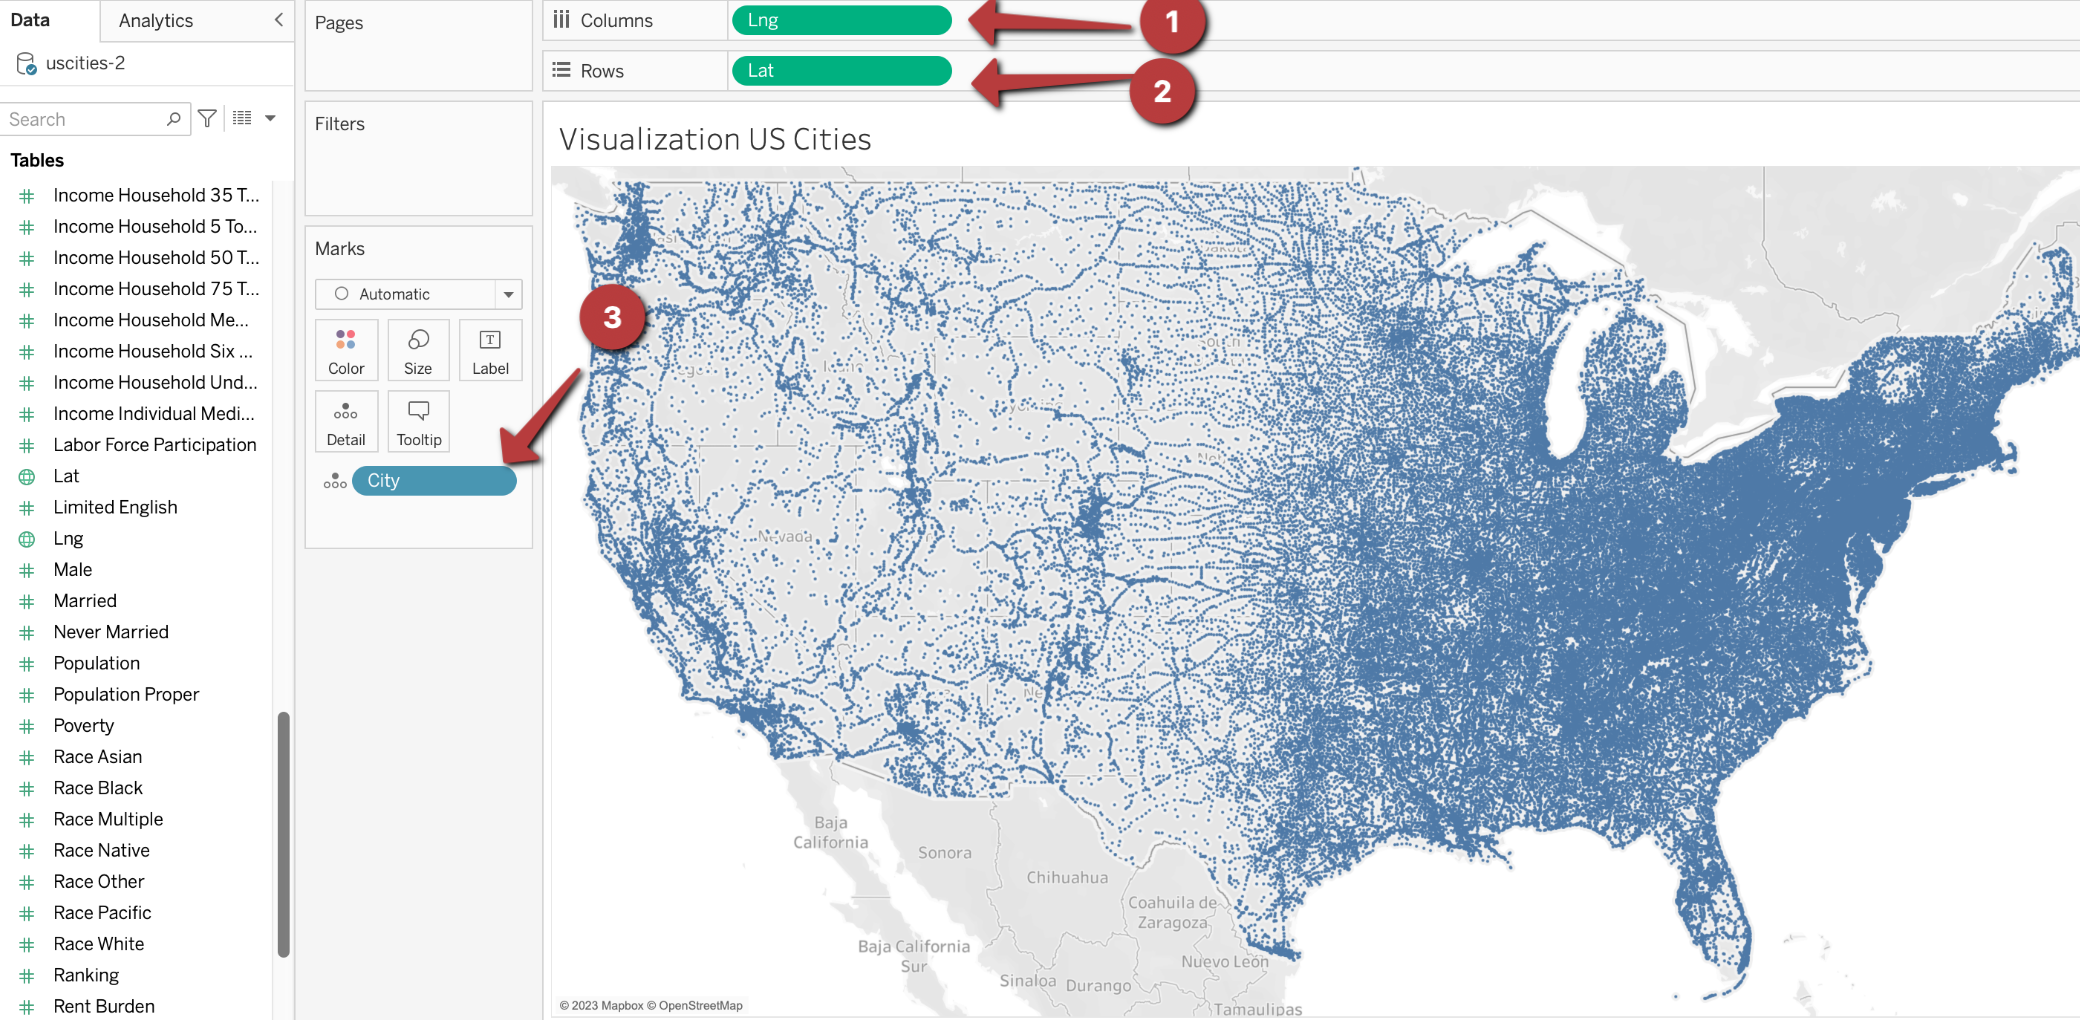
We will create a visual representation of the US Cities in the database. To do this, drag the Lng and Lat fields to the Columns and Rows shelves respectively. Then, add the City field under the "Marks" column. This will create a map showing the location of the cities in the database.

Now that you have your data imported into Tableau, you can use Tableau to create all sorts of visualizations based on the demographic data in our databases. You can learn more from Tableau's documentation.
Home (Maps) | Database License | Privacy | Database Releases | Database Order Lookup | Resources | Contact | FAQs
SimpleMaps.com is a product of Pareto Software, LLC. © 2010-2024.