Excel's Filter feature allows you to sift through extensive datasets, focusing on specific criteria and gaining valuable insights. Whether you're seeking to sort, search, or segment data, the "Filter" tool can help. In this tutorial, we'll guide you step-by-step through the process of utilizing the "Filter" tool within the context of our US Cities Database. You can use either the free our paid version of the database.
Assuming you have the "US Cities Database" already loaded in Excel, open the spreadsheet to get started.
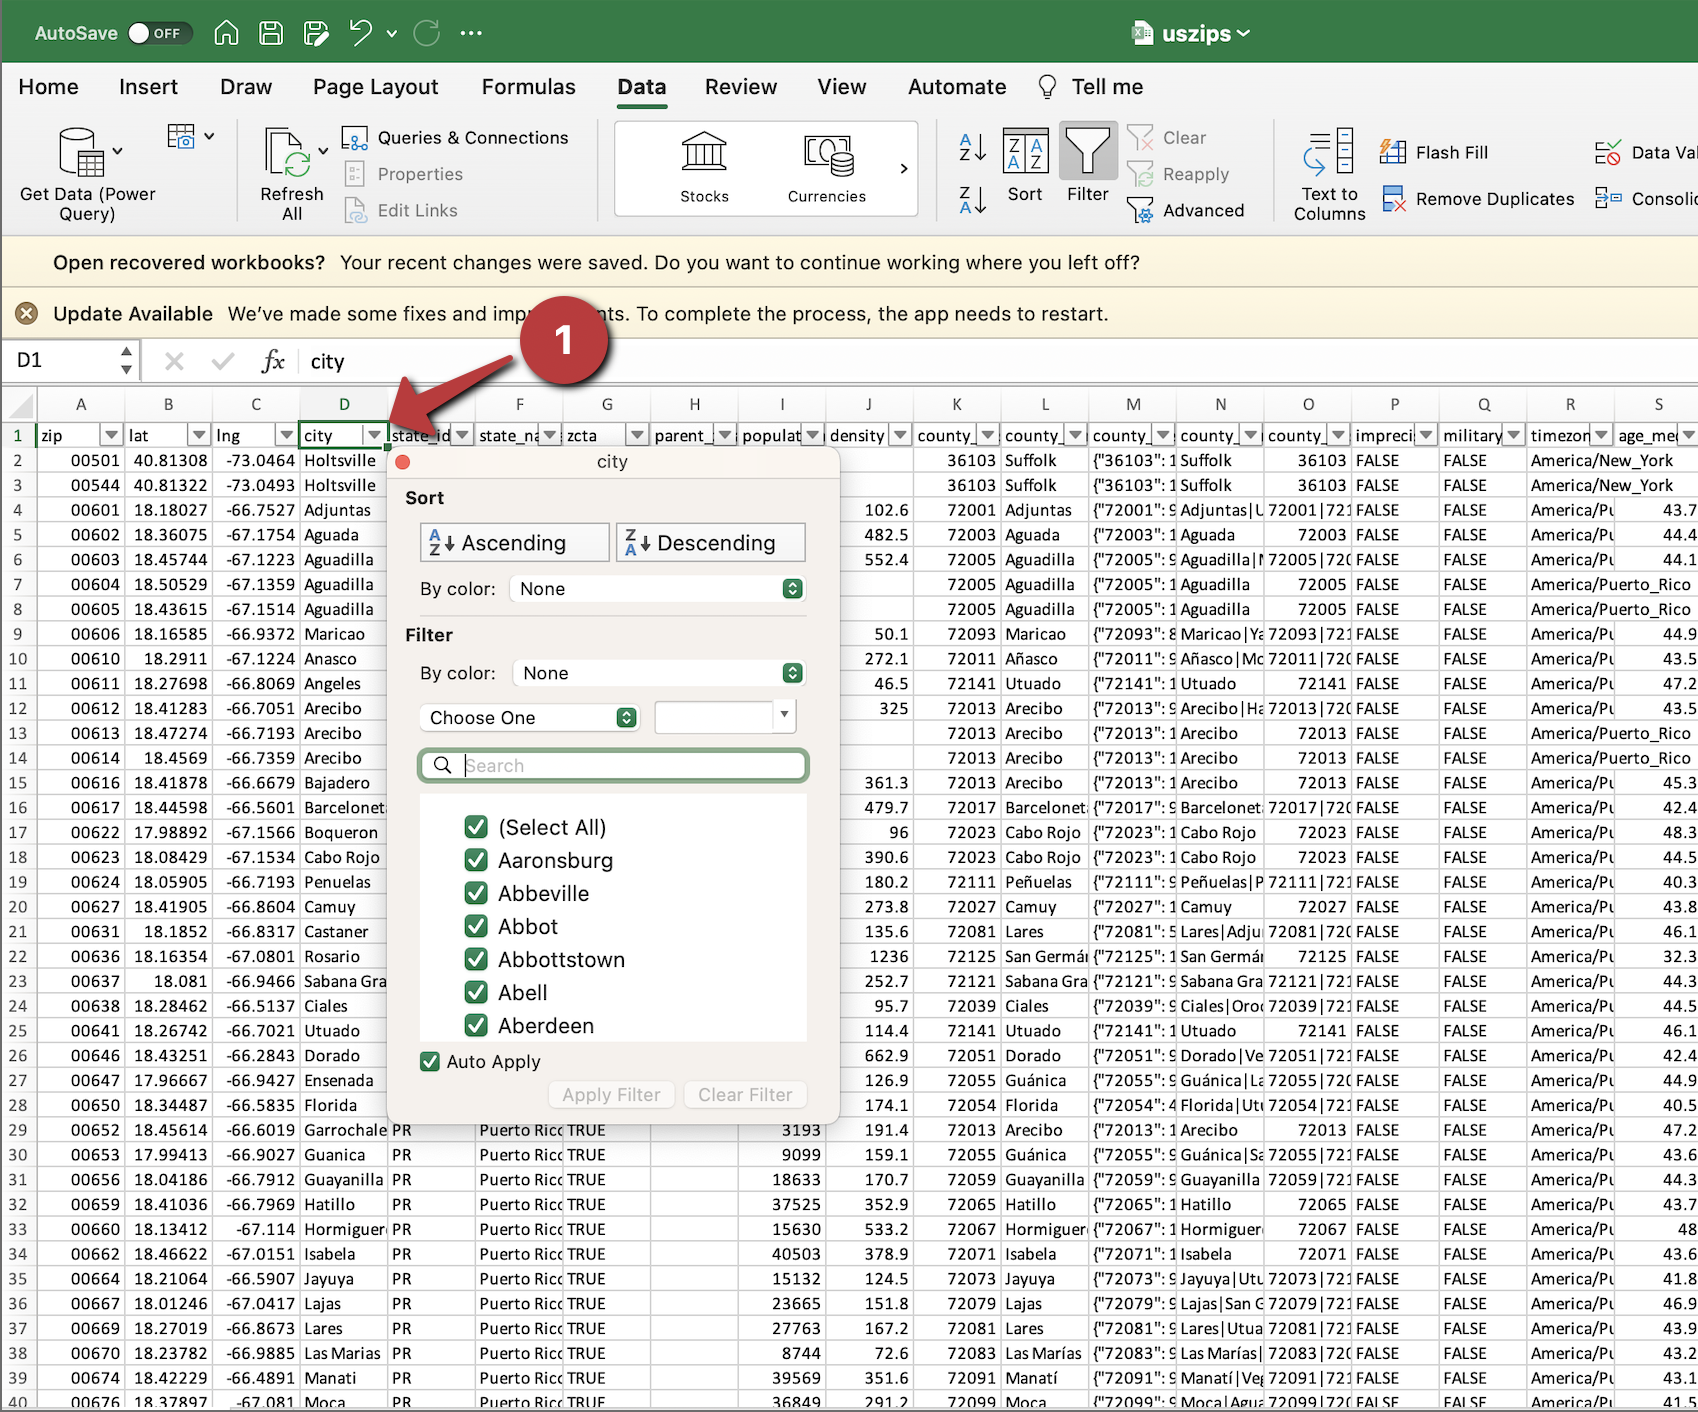
Click on any cell within the column headers of your database. For example, click on the header of the "City" column.
In the "Data" tab on the Excel ribbon, locate the "Sort & Filter" group. Click on the "Filter" button. This will add drop-down arrows to the headers of each column.
![]()
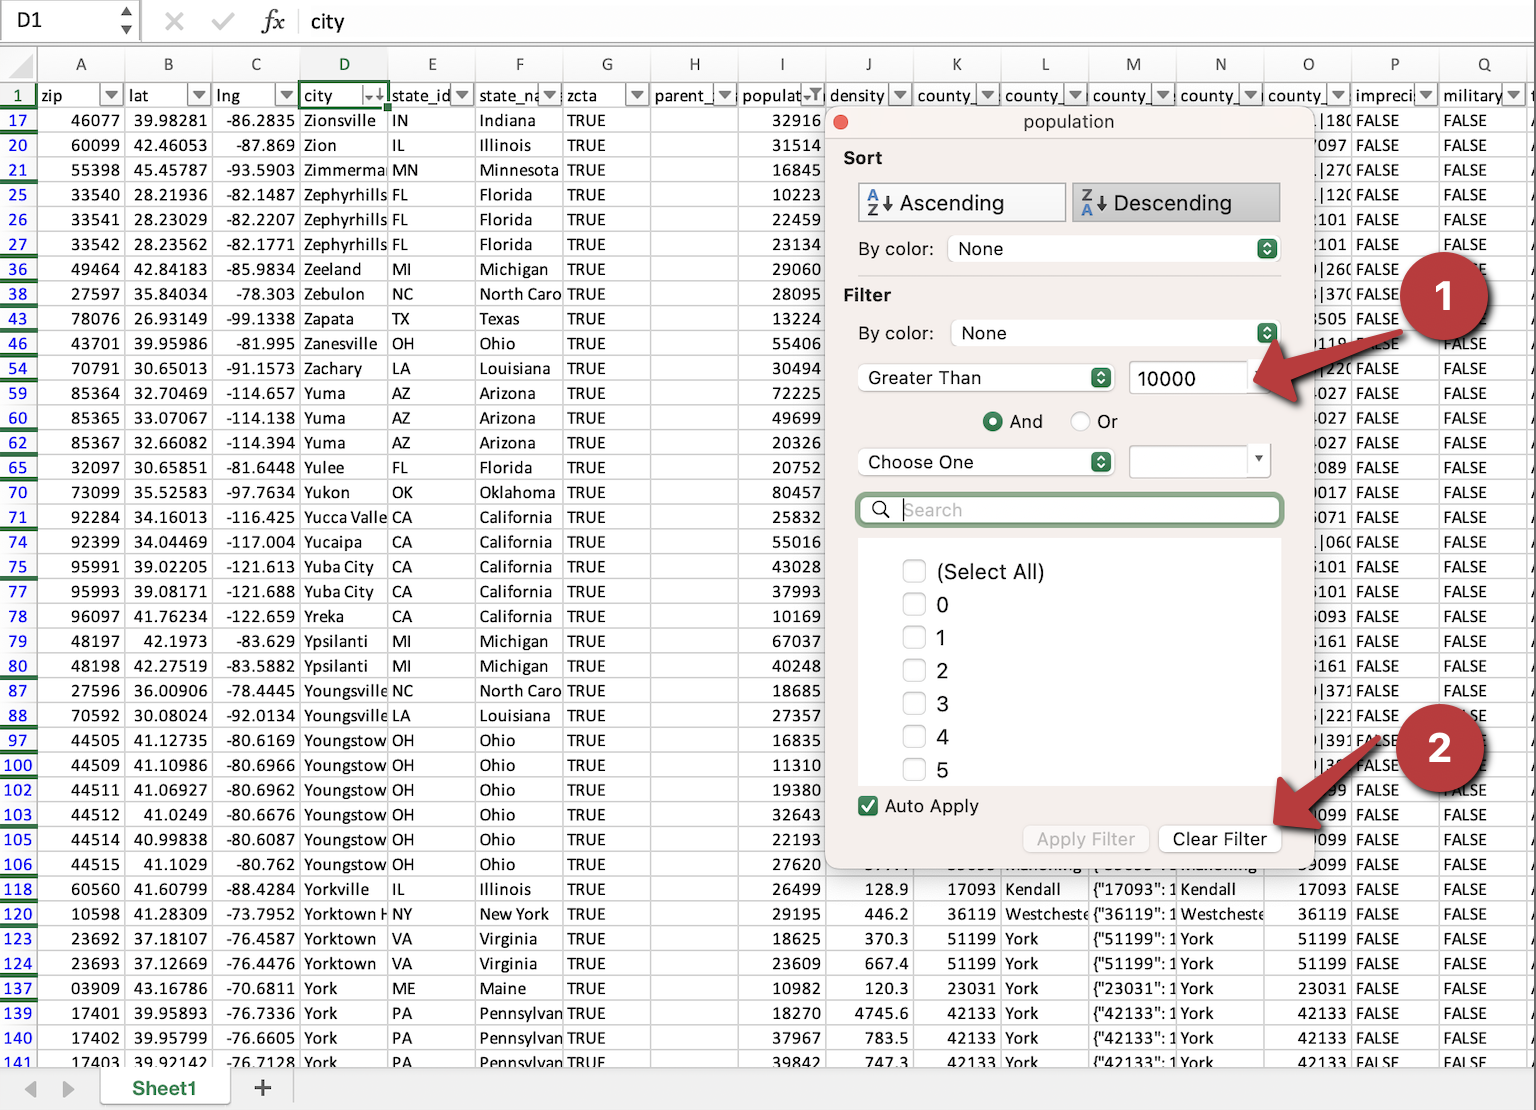
Click on the drop-down arrow in the column you want to filter. Let's say you want to filter cities by their population. In the drop-down menu, you can see various filter options. You can select specific items, sort ascending/descending, or use custom filters.

To clear a filter and show all data again, go to the column header with the applied filter. Click on the filter drop-down arrow. In the drop-down menu, click on "Clear Filter From [Column Name]

If you encounter any difficulties or have questions, please don't hesitate to reach out to us at support@simplemaps.com.
Home (Maps) | Database License | Privacy | Database Releases | Database Order Lookup | Resources | Contact | FAQs
SimpleMaps.com is a product of Pareto Software, LLC. © 2010-2025.