Lines can be added to the map to create borders or denote routes. For example, our US County uses lines to represent the state borders. Lines can't be clicked or hovered over. They are just for informational purposes. They have been used to show disputed borders and travel routes. Lines must be added via the "Code" tab (or manually via the mapdata.js file).
| Line Properties | |
|---|---|
| name | The name of the line. This won't appear on the map, it is only for organizational purposes. |
| path | The path of the line. You can get this by opening the map's source svg file in Inkscape, drawing a line, converting it to a path, copying that path. Not needed if origin_location and destination_location are used. |
| origin_location | The id of the location from which you'd like the line to start. Not needed if path is used. |
| destination_location | The id of the location from which you'd like the line to end. Not needed if path is used. |
| angle | The angle of the line (from the origin, to the north). |
| color | The color of the line (e.g. #ffffff). |
| size | The width of the line. |
| dash | By default lines are solid. If dash is '-' or '.' the line will be dashed/dotted. |
| level | The z-index position of the line. Larger numbers on top. (defaults: states: 0, lines: 2, labels: 3, locations: 5). |
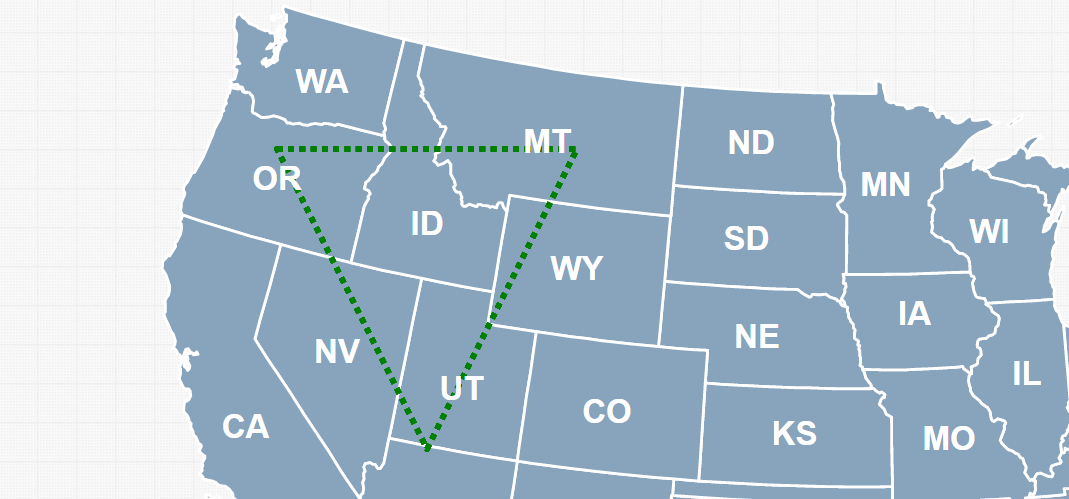
Here's an example using a simple path which draws a triangle:
lines: {
      0: {
         name: "Example",
         path: "M 100 100 L 300 100 L 200 300 z",
         size: "3",
         color: "green",
         dash: "."
      }
  }

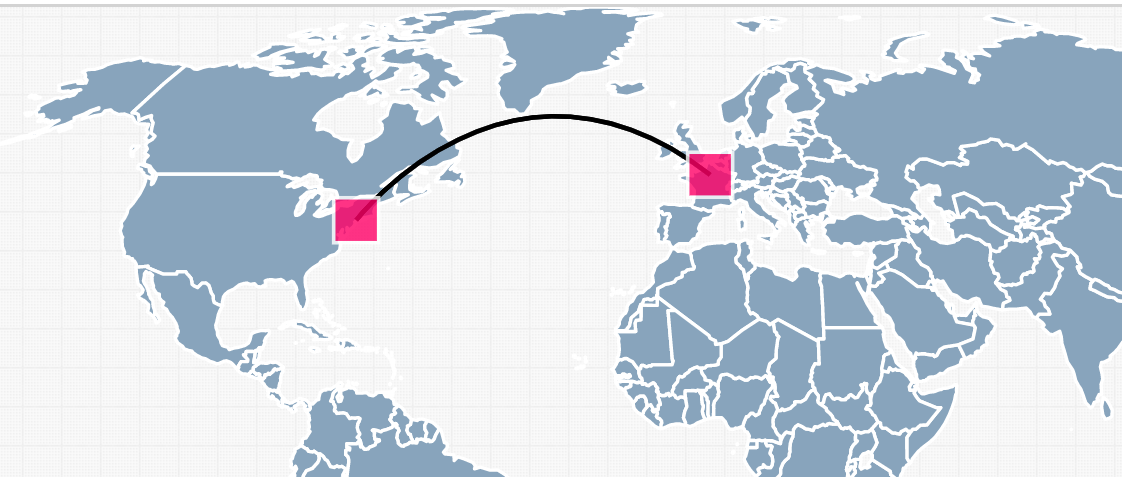
Here's a short example of how to draw a line between New York and Paris:
locations: {
    "0": {
      lat: 40.715,
      lng: -74.007,
      name: "New York City"
    },
    "1": {
      name: "Paris",
      lat: 48.866666670,
      lng: 2.333333333
    }
  },
  lines: {
    "1": {
      name: "Atlantic",
      origin_location: "0",
      destination_location: "1",
      color: "#000000",
      angle: 45,
      size: 2,
      dash: ""
    }
  },

Home | License | Privacy | Releases | Testimonials | Resources | Documentation | Order Lookup | All Maps | FAQs
Formerly FlashUSAmap.com and FlashWorldMap.com
SimpleMaps.com is a product of Pareto Software, LLC. © 2010-2025.